Trace Linking
Trace Linking in R-Visor
Description
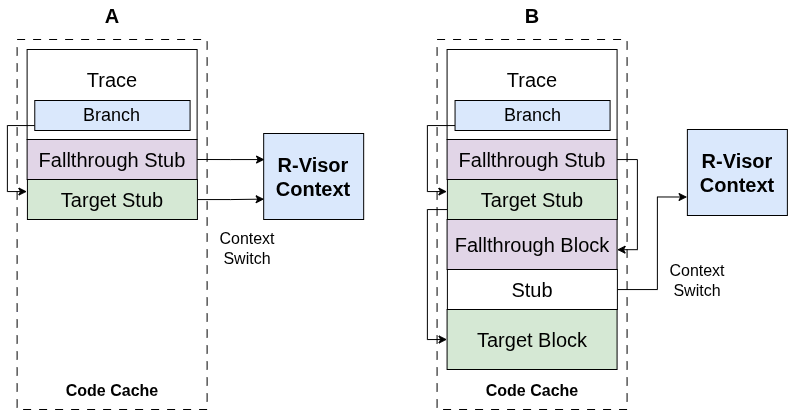
During binary execution, R-Visor regains control under the following scenarios: * The next basic block is not already in the code cache. * The dispatcher cannot statically determine the target of a control-flow instruction during Basic Block (BB) allocation. * R-Visor needs to execute an instrumentation routine.
In the absence of these conditions, the basic blocks can be connected directly in the code cache, minimizing the overheads associated with context switches back to R-Visor. We use this ideology for our version of trace linking. Separate algorithms are used by R-Visor to achieve trace linking for direct jumps and branches. However, these internal mechanisms are abstracted from the user to simplify the R-Visor API.
Use Case
To measure the impact of trace linking, we will execute a no_instrumentation routine (a routine that performs no explicit instrumentation actions) with and without trace linking enabled. This will be done by measuring the execution cycles and instruction count, through RISC-V's Hardware Performance Counters (HPCs).
Measuring metrics without trace linking
By default, trace linking is often disabled in R-Visor. We can enable the recording of metrics by modifying the CMakeLists.txt file.
-
Enable Metrics Flag: Insert the
-DMETRICSflag into your C compilation flags. This allows conditional compilation of code sections designed for metric collection. -
Specify Executable: Ensure that the executable being built is the
no_instrumentation.croutine. Createroutines/no_instrumentation.cwith basic R-Visor setup but no actual instrumentation calls (or a minimal exit routine if METRICS is defined).A minimal# CMakeLists.txt add_executable(no_instrumentation ${ROUTINESDIR}/no_instrumentation.c ${HEADER_FILES})routines/no_instrumentation.cfor metrics might look like this:#include <stdio.h> #include <stdlib.h> #include "../src/rail.h" // Core R-Visor API #include "../src/logger.h" // For set_logging_file, rvisor_logger #ifdef METRICS static uint64_t start_cycle, end_cycle; static uint64_t start_instr, end_instr; void exit_routine_metrics_no_instr(uint64_t *regfile) { asm volatile ("csrr %0, instret" : "=r"(end_instr)); asm volatile ("rdcycle %0" : "=r"(end_cycle)); fprintf(rvisor_logger, "Total elapsed cycles: %lu\n", (unsigned long)(end_cycle - start_cycle)); fprintf(rvisor_logger, "Total instructions executed: %lu\n", (unsigned long)(end_instr - start_instr)); if (rvisor_logger) fclose(rvisor_logger); } #endif int main(int argc, char** argv, char** envp) { if(argc < 2) { printf("Please provide a target binary\n"); exit(1); } set_logging_file("no_instrumentation_logs.txt", "w"); rvisor_init(argv[1]); rvisor_register_args(argc, argv, envp); #ifdef METRICS rvisor_register_exit_routine(exit_routine_metrics_no_instr); asm volatile ("rdcycle %0" : "=r"(start_cycle)); asm volatile ("csrr %0, instret" : "=r"(start_instr)); #endif rvisor_run(); return 0; } -
Build the Binary:
Runningmakewill build a binary namedno_instrumentationin your build's output directory (e.g.,./bin/no_instrumentation). -
Execute and Collect Metrics: Execute this binary, instrumenting a benchmark like
The metrics would be stored instream:no_instrumentation_logs.txt: (These are example values; actuals will vary.)
Measuring metrics with trace linking
To measure the impact of trace linking, we will create a new C
file,
routines/no_instrumentation_tl.c
. The key
change is enabling trace linking.
-
Create
no_instrumentation_tl.c: This file will be very similar tono_instrumentation.c, but with trace linking explicitly enabled using the R-Visor C API.// routines/no_instrumentation_tl.c #include <stdio.h> #include <stdlib.h> #include "../src/rail.h" // Core R-Visor API #include "../src/logger.h" // For set_logging_file, rvisor_logger #ifdef METRICS // These should be declared to be accessible by the exit routine static uint64_t start_cycle, end_cycle; static uint64_t start_instr, end_instr; // Exit routine to print metrics void exit_routine_metrics_tl(uint64_t *regfile) { asm volatile ("csrr %0, instret" : "=r"(end_instr)); asm volatile ("rdcycle %0" : "=r"(end_cycle)); if (rvisor_logger) { // Check if logger is open fprintf(rvisor_logger, "Total elapsed cycles: %lu\n", (unsigned long)(end_cycle - start_cycle)); fprintf(rvisor_logger, "Total instructions executed: %lu\n", (unsigned long)(end_instr - start_instr)); fclose(rvisor_logger); } } #endif int main(int argc, char** argv, char** envp) { if(argc < 2) { printf("Please provide a target binary\n"); exit(1); } // Change the name of the logging file so that we do not // overwrite the old metrics set_logging_file("no_instrumentation_tl_logs.txt", "w"); // Enable trace linking by setting the global flag BEFORE rvisor_init rvisor_trace_linking_enabled = 1; rvisor_init(argv[1]); rvisor_register_args(argc, argv, envp); #ifdef METRICS rvisor_register_exit_routine(exit_routine_metrics_tl); // Record start time/instructions just before running the instrumented code asm volatile ("rdcycle %0" : "=r"(start_cycle)); asm volatile ("csrr %0, instret" : "=r"(start_instr)); #endif rvisor_run(); return 0; } -
Modify
CMakeLists.txtto buildno_instrumentation_tl.c: -
Build the Binary:
Runningmakewill build a binary calledno_instrumentation_tl. -
Execute and Collect Metrics with Trace Linking: Once again, execute this binary while instrumenting the
The metrics would be stored instreambenchmark:no_instrumentation_tl_logs.txt: (These are example values; actuals will vary.)
After comparing the results from
no_instrumentation_logs.txt
and
no_instrumentation_tl_logs.txt
, it is evident that
there can be a very large improvement in the cycle and
instruction count (e.g., ~85% reduction in the example numbers)
when trace linking is enabled for scenarios with minimal R-Visor
intervention.
Conclusion
Although we have demonstrated that trace linking significantly improves the computation performance of a binary being instrumented (when no frequent C routines are called), this was shown without complex instrumentation routines present at high frequency (e.g., per basic block). By default, if C-based instrumentation routines are registered to run at every basic block or instruction, they require a context switch to R-Visor. Thus, the benefits of using trace linking would be diminished in such cases. To overcome this and maintain performance even with frequent, short instrumentation tasks, R-Visor implements another optimization called routine inlining .